Project Background:
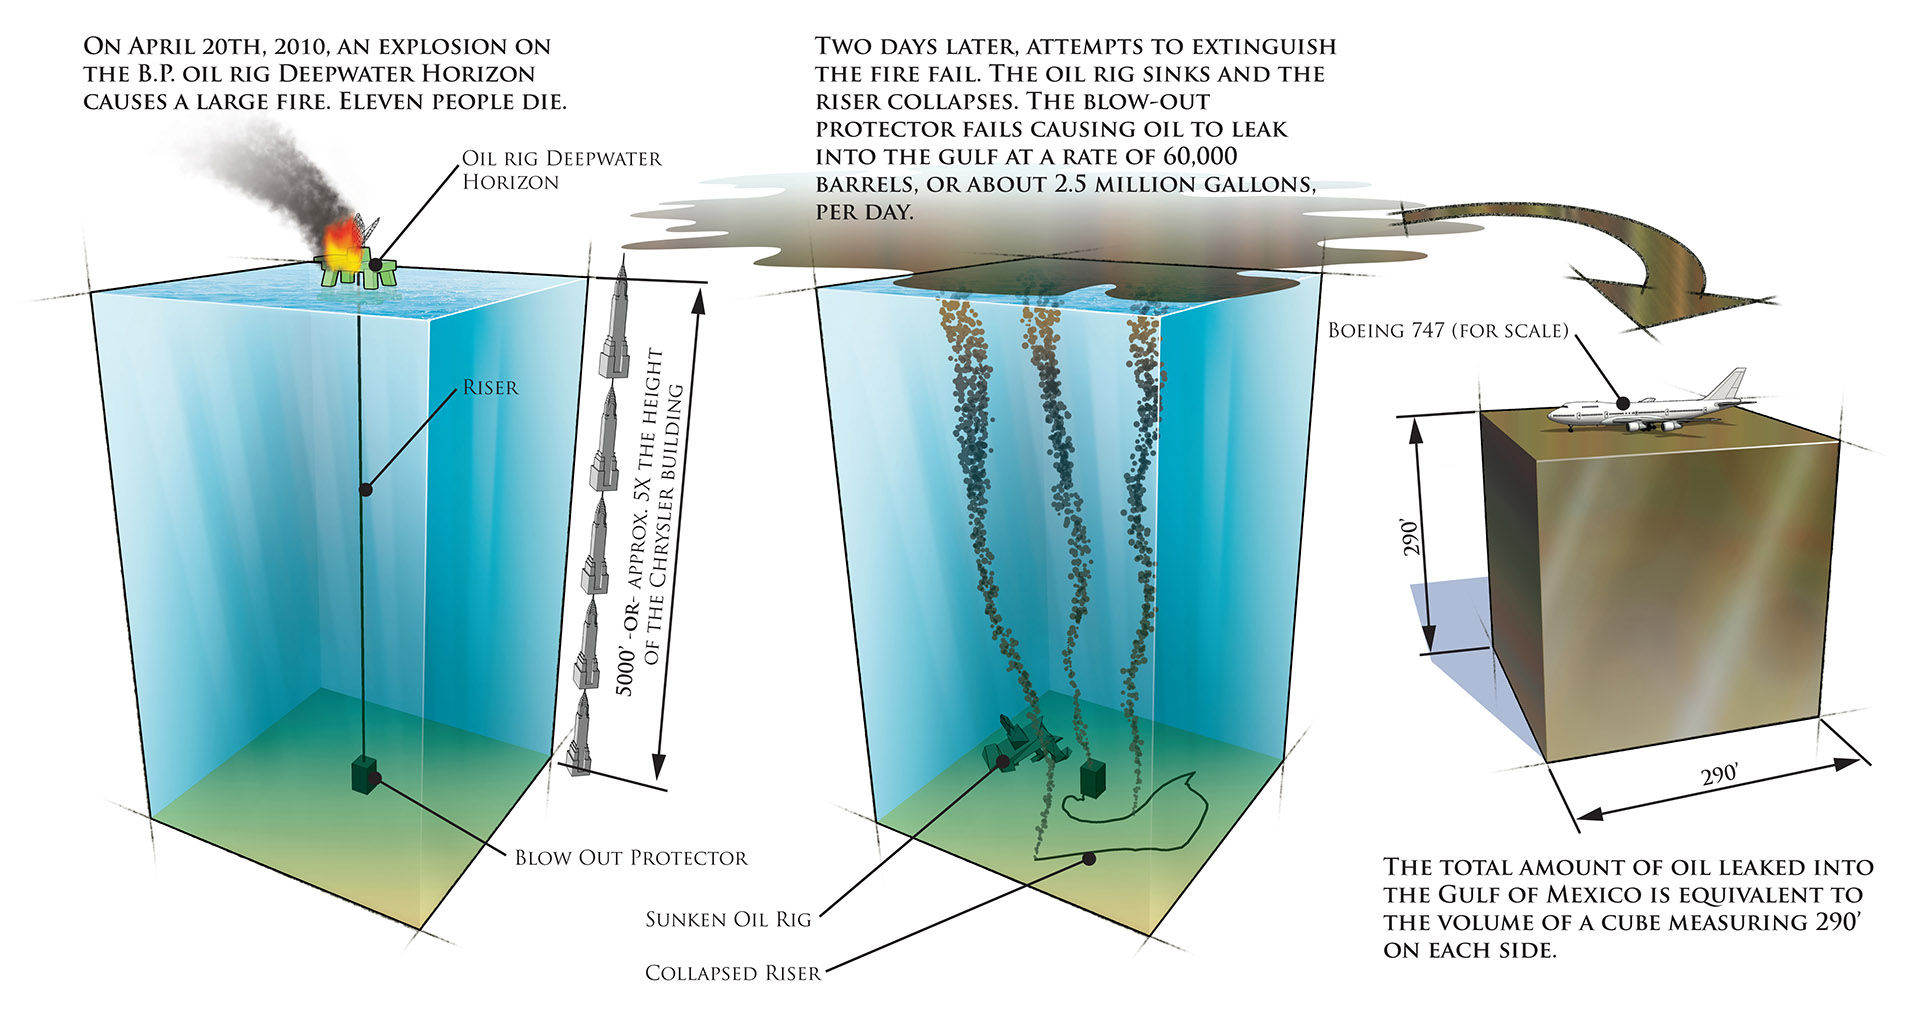
During the BP oil spill in the Gulf of Mexico, I started working on this infographic. I originally had the cube of oil sized to represent the amount of oil per day being spilled, but updated it to total oil spilled after they finally stopped the oil leak. I recently checked the total amount of oil spilled into the Gulf, and the cube size should be updated to be about 303 feet on each side
Illustration Process:
I used SketchUp to produce the 3D underlay for the infographic. Then I rendered it in Photoshop and added text and other annotations. Like all of my technical drawings, I used a crisp style, but with some sketchy linework accents as a nod to an earlier time when you had to project lines toward vanishing points by hand.


